Infographics

Next I needed to explore more into infographics. Generally an infographic is a visual representation of information/data/knowledge.

Here are some infographics that I found and specifically liked:

1a32cd147f99e834a8c5bea5f9964d1d 2467c83b1837d248e9c9620052d89839 3539a5028859416976f2408ab0f3770f c61624807af990b3138eb037e1765bf5

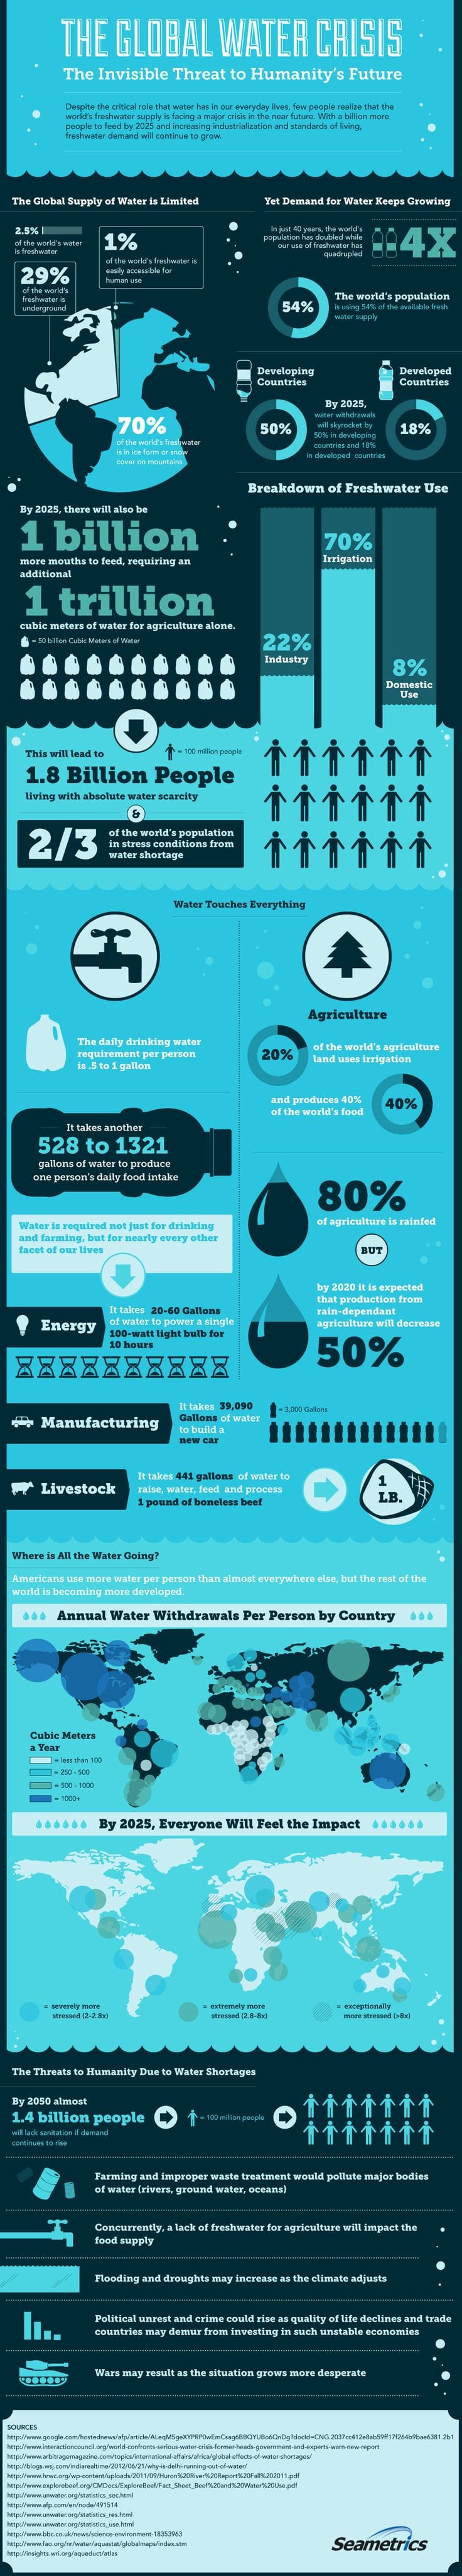
Key points on these that I need to include:

  • Grid system
  • Adobe Kuler colour scheme
  • Sophisticated vector graphics
  • Other visual representations like pie charts and graphs
  • Lines and colours to separate different sections

What I like about them is that where a paragraph or large chunk of text would generally be off-putting, an infographic is actually pleasing to the eye and draws you in to learn instead of boring you or pushing you away.

So I have already decided from this that my infographic also needs to be pleasing to the eye.


The only thing that I have created that is similar before is an infographic for coffee, where I was just simply playing around with Adobe Illustrator to get to know the tools a bit better. Here is what I created (not finished):
Screen Shot 2015-10-28 at 17.08.55

Einstein!

Before I can even start to think about making an infographic about the Theory of Relativity, I need to learn a bit more about Einstein and what he discovered.

Here are some facts about Einstein that I found interesting/relevant:

  • Born in Ulm, Germany 1879
  • He was a “lazy” student and dropped out of school (15)
  • He graduated near the bottom of his class (21)
  • Failed military physical tests because of his sweaty feet! (22)
  • Everyday he would complete his job within 2 hours and then do his own science work (24)
  • Discovered light is a particle and a wave (26)
  • E=MC2 and special relativity (26)
  • Becomes a professor (30)
  • Discovers general relativity (32)
  • Wins Nobel prize (43)
  • Starts working on theory of everything (44)
  • Moves to America (54)
  • Rejects becoming president of Israel (74)
  • Died wishing he knew more about math (76) 1955

For our brief we need to create an infographic specifically on the Theory of Relativity, so I researched that too:

There are 2 ideas that back up the theory: the laws of physics are the same for any inertial (resistance) reference frame and the speed of light in a vacuum is the same for everyone, regardless of their motion or motion from the source of light.

 Results of the theory:

A result of the theory is E=MC2

E is energy, m is mass and c is the constant speed of light. Energy and mass are related: change in an object’s energy is accompanied by a change in mass.(Important for nuclear energy)

Another result of relativity is length contraction:
Objects appear shorter the faster they are moving in relation to the observer (only occurs at high speeds)

Other notes:
Nothing is ever fully resting- the galaxy and universe and earth are always moving.