Kraken Rum

For my website and possibly logo, I have had the idea of having a large octopus on the screen. A brand that already successfully uses an octopus is Kraken Rum.
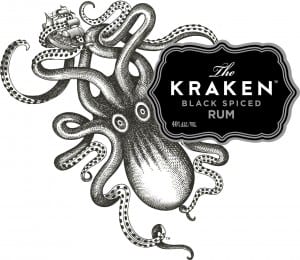
 

kraken-logo-high-res-1


This is the Kraken logo. I love the hand drawn octopus design with its wild eyes and tentacles waving about everywhere. I also like the way the octopus has been shades with dots. The addition of the boat also works well, as well as tying in with the legend of a rum boat vanishing in the sea and possibly being taken by a giant octopus.

The area around the text looks like an ink splodge crossed with an old fashioned rum bottle label in pirate films. The entire logo does bring pirate films to mind with its old fashioned look and the fact it is rum.

The like the calligraphy style type for the ‘The’ and then the widely spaced sans serif type below. The difference between the white and grey type makes the important areas stand out (the name) adding priority and order to the logo.


This is a screenshot of the website:

Screen Shot 2016-01-20 at 11.10.47

The wbsite has a simple layout with the menu bar down the left hand side and then a video taking up the majority of the screen. The use of black and white works well as it makes the product appear as though it is under the sea. Theimages below the video are gifs that move as you scroll down, adding interest to the page. I like the gritty sans serif 3D font on the video and feel it works really well with the pirate style of the page.

Screen Shot 2016-01-20 at 11.13.39This is a screenshot of the top of one of the pages on the Kraken website. I love the old look to it, as though it is a really old film or chalk board. I like the use of tentacles as the swirly bits above the title of the page as well as the combination of fonts on the page.

Brief 3 ideas!

For our third brief, the corporate identity package, I am very interested in the tattoo company idea and the estate agency. I initially thought that I would look into the barber shop, but then decided that the route that I would go down would be too stereotypical and I would just be using basic barber shop vectors. I also do not know much about male facial hair, whereas I am interested in property and nautical themes and watch the programme Tattoo Fixers, which ties in nicely with the tattoo brief.

First of all, I thought I would look at some corporate identities that other people have designed on Pinterest:

I like the logo on the photo of oysters as well as the hand-drawn fish that this man has created. It also ties in with the nautical theme of the tattoo brief. Not only has he designed a logo, but some bottle ideas and bags as well as other branded items. This looks similar to all of our branding briefs and so I feel these photos are relevant.

oysters

fish

This is another nautical branding package that I love. The pastely pale colours along with the simple sea creature designs work really effectively. I also like the way the products have been laid out to be photographed.

Screen Shot 2016-01-20 at 10.30.41


This is the logo of a barber and tattoo shop in America. I feel it has a simple but effective design with the little images of a tattoo pen and razor. I like the use of black and gold – I feel like the black works well for the line of business and then the gold makes it stand out as a successful company.


Screen Shot 2016-01-20 at 10.35.37


This is the website of a high-end estate agency in Suffolk (where I live) although I think they are nationwide. I have noticed they have used the colour gold with black and white again, making it look a prestigious company before you know what it is. The little logo of a pillar/column adds to the upmarket approach the company are going for. I like the easy look to their website and feel that their branding works well.

Three different layouts

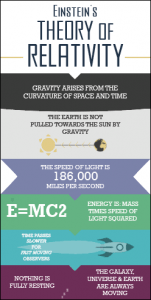
For our brief, we had to make sure our infographic would fit an A2 page, a smartphone screen and a desktop.

To create my infographic, I started off by making it with A2 dimensions. This means the text can be smaller as if this infographic were to be printed, it would all be blown up to fit an A2 page. I also decided to make it a long, thin design (as long as an A2 page but thinner/in need of cropping) as a lot of infographics are a long, thin shape. I also added a bleed to this page as it has been designed to be printed. This is my A2 infographic:

Screen Shot 2015-11-18 at 11.20.54

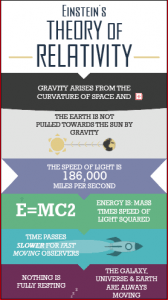
For the phone layout, as well as shaping my infographic to the dimensions of a phone screen, I made the text bigger so that it is more legible from a smaller screen. I stuck to the long, thin, style, but just enlarged certain areas so that you can read it on a phone. To check it would work, I placed my phone against the screen and made my infographic the same size next to it to ensure I could read it. Here is my phone infographic:

Screen Shot 2015-11-18 at 11.23.26

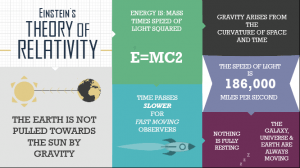
For the final layout, I had to totally rethink my infographic. A desktop is landscape and my design had previously been portrait, so I had to create a new grid that would fit a landscape page. To make sure there was still hierarchy, I made the boxes to the left (where you start to read a page from) larger and the text bigger, and then made everything smaller as it goes across the page. I also used square boxes instead of rectangles to divide my information as it fits the page better. Luckily, as I already had a colour scheme at hand and all of the text available, this did not take too long to do. Here is my desktop layout:

Screen Shot 2015-11-18 at 11.26.10

Final tweaks will be made to these before I submit them, but for now I am happy with how they look and the progress that I have made.

It’s all about detail

I wanted to add some little, not necessarily noticeable details, to my infographic. Here are some examples:

Screen Shot 2015-11-17 at 21.22.09

I decided to add a curve to this box. This is because the fact above it is about ‘curvature’, and so I thought adding a curved bottom to the box would add to this fact, as well as make the box look more interesting.

Screen Shot 2015-11-17 at 21.22.15

This fact is about speed, and a way of portraying speed is often by using arrows. I then decided to change the shape of the box by adding two arrows on the sides of it, to visualise the idea of speed.

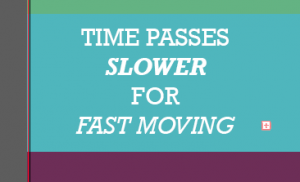
Screen Shot 2015-11-17 at 21.25.42

To make the word ‘slower’ actually appear to be slower, I decided to make the text bold and italic, as though it is heavier and so being slowed down. I then made the ‘fast moving’ light and italic, to make it appear as though it is moving fast and is lighter than the word ‘heavy’.

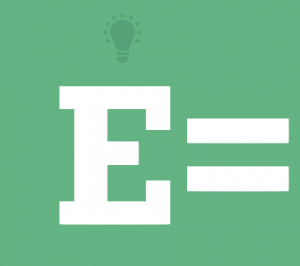
Screen Shot 2015-11-17 at 22.25.10Einstein had a lightbulb moment when coming up with the equation E=MC2, so I decided to give ‘E’, which could represent Einstein as well as energy, a lightbulb too.

Progress

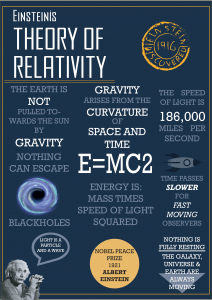
This is the first infographic I created:

Relativity print copy1

Things I like about this

  • The space colour scheme from Adobe Kuler
  • The typeface used for the title
  • The typeface for the main body
  • The stamp I created in the top right corner

Things I don’t like

  • The layout is messy
  • There is no hierarchy
  • The bottom speech bubble

So after creating my first infographic, I decided I would go back to looking at other people’s infographics. I needed to work on the hierarchy of my information as there was no order on my page, so I initially thought of turning my infographic into a giant, colourful grid to try and make it easier to read.

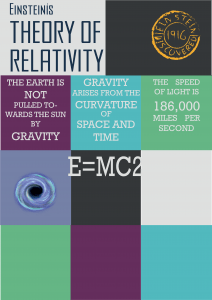
This is my second attempt:

Idea 2

Things I like

  • The new colour scheme – there is more variety than with the first one

Things I don’t like

  • The squares system does not work
  • Still no hierarchy

So after creating this, I noticed something else about other infographics: they are often long so the viewer has to scroll down, which creates hierarchy and an order of reading on the page. So I decided to create a longer infographic where my reader will have to scroll down or read down the page too. To separate the information, I then decided to put my information in boxes that span across the page.

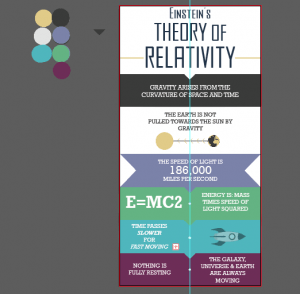
My third attempt:

Screen Shot 2015-11-17 at 21.00.40

It is still working progress, hence the screenshot with my colour scheme on Illustrator. However, I much happier with this final infographic idea. It still fits an A2 page, but is easier to read, more pleasing to the eye and has an order to it.